Q1 Revenue of $5.9 Million and 220MW of New Projects in Development
ALBANY, N.Y.–(BUSINESS WIRE)–$SLNH #SLNH–Soluna Holdings, Inc. (“Soluna” or the “Company”) (NASDAQ: SLNH), a developer of green data centers for intensive computing applications, including Bitcoin mining and AI, announced its financial results for the quarter year ended March 31, 2025.
“Our outlook shines brighter with expanding project development at Projects Rosa, Ellen, and Hedy. First quarter results reflect operational stamina amidst challenges from market headwinds, commercial model shifts, weather events, and customer deployment delays,” said John Belizaire, CEO of Soluna.
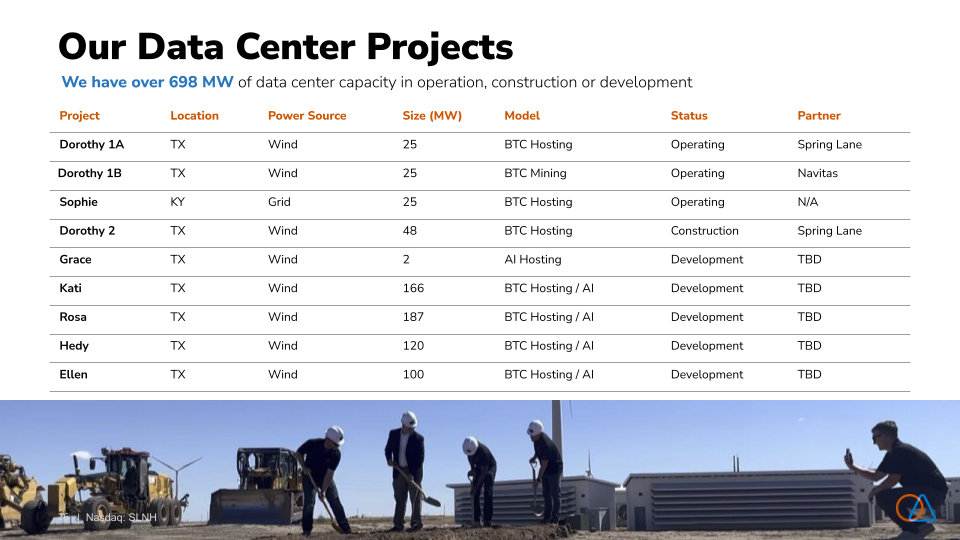
“During the first quarter of 2025, we continued construction of Project Dorothy 2, which is expected to increase our Bitcoin Hosting capacity to 123MW. We also expanded our project pipeline in South Texas to meet future demand for sustainable AI compute and Bitcoin Hosting. We believe these milestones continue to demonstrate our growth potential.”
“We are focused on the growth of our substantial pipeline of projects into AI/HPC data centers during 2025, beginning with Project Kati,” said John Tunison, CFO of Soluna.
“Additionally, in recent months, we have made substantial progress towards simplifying our capital structure, including fully converting the outstanding convertible loan notes in Q4 2024, paying off the Navitas loan at Project Dorothy 1B and securing modifications to the terms of our Series B Preferred Stock, all of which we believe has strengthened our ability to raise the growth capital needed to execute on our strategic plan,” continued John Tunison.
2025 Operational and Corporate Highlights:
- We simplified our capital structure by fully converting Convertible Loan Notes last year, significantly restructuring the Preferred B equity, and paying off the Navitas loan at Project Dorothy 1B.
- We have continued construction of Project Dorothy 2, and the initial phase of powering up that facility is underway, which is expected to increase our Bitcoin hosting capacity by 64%, reaching a total of 123 MW (with an expected completion timeline of Q4 2025).
- Soluna AL CloudCo LLC (“CloudCo” or “Project Ada”) completed a strategic termination of the HP Enterprises (“HPE”) contract – the strategic termination of the contract has enabled the Company to refocus on crypto-mining and the future development of AI data centers. Following CloudCo’s notice of termination, HPE terminated the services in April of 2025. The financial impact of the termination on Soluna’s consolidated financial statements as of and for the year ended December 31, 2024, was reported in the Company’s Annual Report on Form 10-K filed with the Securities and Exchange Commission (“SEC”) on March 31, 2025.
- Non-dilutive Financing Closed with Galaxy – Soluna SW LLC closed a $5 million debt facility with Galaxy Digital, secured by the assets of Project Sophie.
- Expanded Project Pipeline up to approximately 698MW in operations, construction, and development – as of today, the Company added two new projects (Hedy and Ellen) totaling 220MW. Project Kati (166MW) is now shovel-ready with capital formation underway. Project Rosa (187MW) land acquisition agreements were signed in February 2025. We now have a line of sight to 698MW of data center capacity (for AI and Bitcoin) to be in development over the next twenty-four months.
- Second Patent Awarded – Soluna’s second utility patent was awarded (Patent #: US12250794B2) in April 2025, which broadens the scope of Soluna’s Modular Data Center patent (Patent #: US11974415B2), focusing on the layout of modular data center buildings on a site.
First Quarter Financial and Operational Highlights:
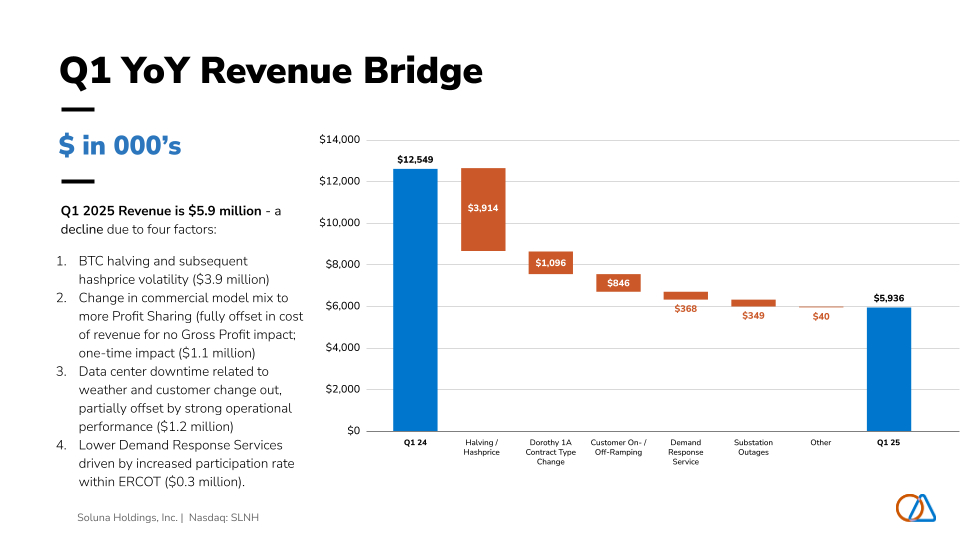
- Short term Revenue Decline – Revenue declined when compared to same period in 2024, due to four factors: 1) BTC halving and subsequent hash price volatility, 2) change in commercial model mix to more Profit Sharing (fully offset in cost of revenue for no Gross Profit impact; one-time impact), 3) data center downtime related to weather and customer change out, partially offset by strong operational performance, and 4) lower Demand Response Services driven by increased participation rate within ERCOT.
- Revenue Generation Poised for Growth – Given the one-time nature of the commercial model mix shift and data center downtime, and timing of the next BTC halving, we expect Revenue to stabilize and grow as we continue to commission additional MW of Bitcoin Hosting capacity over the next 2 years related to Dorothy 2 and Kati.
- Strong Cash Balance Continues – Unrestricted cash grew to $9.2 million, a $1.4 million increase, from December 31, 2024.
- Gross Profit Declined – excluding Project Ada / CloudCo, driven by the above-mentioned Revenue drivers and partially offset by lower cost of revenue related to the shift to more Profit Share contracts, gross profit declined by $5.7 million from Q1 2024 to $1.2 million.
- Selling, General & Administrative Expenses, excluding depreciation and amortization – increased by $2.0 million from Q1 2024 to Q1 2025 driven by higher Stock Compensation Expense and Professional Fees related to the Yorkville Advisors Standby Equity Purchase Agreement and compliance.
- Net Income declined Q1 2024 to Q1 2025 by ($4.8 million) – driven by the above-mentioned Revenue, Gross Profit and SG&A drivers of a decline of $7.6 million Operating Loss, plus the Extinguishment of Convertible Loan debt and gain – +$3.6 million – on the acquisition of Cloud Notes, which was partially offset by $0.8 million combined higher Interest, Tax and Other Expenses.
- Adjusted EBITDA Declined Q1 2024 to Q1 2025 – driven by the above-mentioned Revenue, Gross Profit, and SG&A drivers, Adjusted EBITDA declined by $6.8 million to a loss of $1.6 million.
- Adjusted EBITDA Improved Q4 2024 to Q1 2025 – $0.9 million improved over Q4 2024, primarily driven by the termination of Project Ada/CloudCo HPE contract and associated mitigation of expense, and also the above-mentioned hash price and outage drivers.
|
Q1 2025 Revenue & Cost of Revenue by Project Site |
||||||||||||||||||||||||||||
| Digital | Cloud | Total | ||||||||||||||||||||||||||
| (Dollars in thousands) |
Project Dorothy 1B |
Project Dorothy 1A |
Project Sophie |
Other |
Digital Subtotal |
Project Ada | ||||||||||||||||||||||
| Cryptocurrency mining revenue | $ |
2,999 |
|
$ |
– |
|
$ |
– |
|
$ |
– |
|
$ |
2,999 |
$ |
– |
|
$ |
2,999 |
|||||||||
| Data hosting revenue |
– |
|
1,371 |
1,031 |
– |
|
2,402 |
|
– |
|
2,402 |
|
||||||||||||||||
| High-performance computing service revenue |
– |
|
– |
|
– |
|
507 |
507 |
|
– |
|
507 |
|
|||||||||||||||
| Demand response services |
– |
|
– |
|
– |
|
– |
|
– |
|
28 |
28 |
|
|||||||||||||||
| Total revenue |
2,999 |
|
1,371 |
|
1,031 |
|
507 |
|
0 |
5,908 |
|
28 |
|
5,936 |
|
|||||||||||||
| Cost of cryptocurrency mining, exclusive of depreciation | $ |
1,954 |
|
$ |
– |
|
$ |
– |
|
$ |
– |
|
$ |
1,954 |
|
$ |
– |
|
$ |
1,954 |
|
|||||||
| Cost of data hosting revenue, exclusive of depreciation |
– |
|
885 |
|
372 |
|
70 |
|
1,327 |
|
– |
|
1,327 |
|
||||||||||||||
| Cost of high-performance computing service revenue |
– |
|
– |
|
– |
|
– |
|
– |
|
7 |
|
7 |
|
||||||||||||||
| Cost of cryptocurrency mining revenue- depreciation |
1,074 |
|
– |
|
– |
|
– |
|
1,074 |
|
– |
|
1,074 |
|
||||||||||||||
| Cost of revenue- depreciation |
– |
|
295 |
|
106 |
|
– |
|
401 |
|
– |
|
401 |
|
||||||||||||||
| Total cost of revenue | $ |
3,028 |
|
$ |
1,180 |
|
$ |
478 |
|
$ |
70 |
|
$ |
4,756 |
|
$ |
7 |
|
$ |
4,763 |
|
|||||||
| Gross Profit |
$ |
(29 |
) |
$ |
191 |
|
$ |
553 |
|
$ |
437 |
|
$ |
1,152 |
|
$ |
21 |
|
$ |
1,173 |
|
|||||||
|
Q1 2024 Revenue & Cost of Revenue by Project Site |
||||||||||||||||||||||||||||
| Digital | Cloud | Total | ||||||||||||||||||||||||||
| (Dollars in thousands) |
Project Dorothy 1B |
Project Dorothy 1A |
Project Sophie |
Other |
Digital Subtotal |
Project Ada | ||||||||||||||||||||||
| Cryptocurrency mining revenue | $ |
6,396 |
$ |
– |
|
$ |
– |
|
$ |
– |
|
$ |
6,396 |
$ |
– |
$ |
6,396 |
|||||||||||
| Data hosting revenue |
– |
|
3,542 |
1,736 |
– |
|
5,278 |
|
– |
|
5,278 |
|
||||||||||||||||
| High-performance computing service revenue |
– |
|
– |
|
– |
|
– |
|
– |
|
– |
|
– |
|
||||||||||||||
| Demand response services |
– |
|
– |
|
– |
|
875 |
875 |
|
– |
|
875 |
|
|||||||||||||||
| Total revenue |
6,396 |
|
3,542 |
|
1,736 |
|
875 |
|
0 |
12,549 |
|
– |
|
12,549 |
|
|||||||||||||
| Cost of cryptocurrency mining, exclusive of depreciation | $ |
1,841 |
|
$ |
– |
|
$ |
– |
|
$ |
– |
|
$ |
1,841 |
|
$ |
– |
|
$ |
1,841 |
|
|||||||
| Cost of data hosting revenue, exclusive of depreciation |
– |
|
1,737 |
|
514 |
|
– |
|
2,251 |
|
– |
|
2,251 |
|
||||||||||||||
| Cost of high-performance computing services |
– |
|
– |
|
– |
|
– |
|
– |
|
– |
|
– |
|
||||||||||||||
| Cost of revenue- depreciation |
1,084 |
|
284 |
|
150 |
|
5 |
|
1,523 |
|
– |
|
1,523 |
|
||||||||||||||
| Total cost of revenue | $ |
2,925 |
|
$ |
2,021 |
|
$ |
664 |
|
$ |
5 |
|
$ |
5,615 |
|
$ |
– |
|
$ |
5,615 |
|
|||||||
| Gross Profit |
$ |
3,471 |
|
$ |
1,521 |
|
$ |
1,072 |
|
$ |
870 |
|
$ |
6,934 |
|
$ |
– |
|
$ |
6,934 |
|
|||||||
For more details on the HPE contract termination, see the 8-K filing dated March 28, 2025. The audited financial statements and Annual Report on Form 10-K filed with the SEC on March 31, 2025, are available online.
Soluna’s glossary of terms can be found here.
Safe Harbor Statement
This announcement contains forward-looking statements. These statements are made under the “safe harbor” provisions of the U.S. Private Securities Litigation Reform Act of 1995. These forward-looking statements can be identified by terminology such as “will,” “expects,” “anticipates,” “future,” “intends,” “plans,” “believes,” “estimates,” “confident” and similar statements. Other examples of forward-looking statements may include, but are not limited to, (i) statements of Company plans and objectives, including the completion of Project Dorothy 2, our expectations with respect to the development of Projects Hedy and Ellen, and the completion of the land purchase for Project Rosa, (ii) statements of future economic performance, and (iii) statements of assumptions underlying other statements about the Company or its business. Soluna may also make written or oral forward-looking statements in its periodic reports to the SEC, in its annual report to shareholders, in press releases and other written materials and in oral statements made by its officers, directors or employees to third parties. Statements that are not historical facts, including but not limited to statements about Soluna’s beliefs and expectations, are forward-looking statements. Forward-looking statements involve inherent risks and uncertainties, further information regarding which is included in the Company’s filings with the SEC. All information provided in this press release is as of the date of the press release, and Soluna undertakes no duty to update such information, except as required under applicable law.
Non-GAAP Measures
In addition to figures prepared in accordance with GAAP, Soluna from time to time may present alternative non-GAAP performance measures, e.g., EBITDA, adjusted EBITDA, adjusted net profit/loss, adjusted earnings per share, free cash flow, both on a company basis and on a project-level basis, among others. EBITDA is defined as earnings before interest, taxes, and depreciation and amortization. Adjusted EBITDA is defined as EBITDA adjusted for stock-based compensation costs, loss on sale of fixed assets, loss on debt extinguishment and revaluation, placement agent release expense, loss on contract, provision for credit losses, convertible note inducement expense and impairment on fixed assets, fair value adjustment on Standby Equity Purchase Agreement draws and loss (gain) on debt extinguishment and revaluation, net. Project level measures may not take into account a full allocation of corporate expenses. These measures should be considered in addition to, but not as a substitute for, the information prepared in accordance with GAAP. Alternative performance measures are not subject to GAAP or any other generally accepted accounting principle. Other companies may define these terms in different ways. See our annual report on Form 10-K for the year ended December 31, 2024 for an explanation of how management uses these measures in evaluating its operations. Investors should review the non-GAAP reconciliations provided below and not rely on any single financial measure to evaluate the Company’s business.
About Soluna Holdings, Inc. (Nasdaq: SLNH)
Soluna is on a mission to make renewable energy a global superpower using computing as a catalyst. The company designs, develops, and operates digital infrastructure that transforms surplus renewable energy into global computing resources. Soluna’s pioneering data centers are strategically co-located with wind, solar, or hydroelectric power plants to support high-performance computing applications including Bitcoin Mining, Generative AI, and other compute-intensive applications. Soluna’s proprietary software MaestroOS(™) helps energize a greener grid while delivering cost-effective and sustainable computing solutions, and superior returns. To learn more visit solunacomputing.com and follow us on:
LinkedIn: https://www.linkedin.com/company/solunaholdings/
X (formerly Twitter): x.com/solunaholdings
YouTube: youtube.com/c/solunacomputing
Newsletter: bit.ly/solunasubscribe
Resource Center: solunacomputing.com/resources
Soluna regularly posts important information on its website and encourages investors and potential investors to consult the Soluna investor relations and investor resources sections of its website regularly.
|
Soluna Holdings, Inc. and Subsidiaries Condensed Consolidated Balance Sheets As of March 31, 2025 (Unaudited) and December 31, 2024 |
||||||||
|
(Dollars in thousands, except per share) |
|
March 31, 2025 |
|
|
December 31, 2024 |
|
||
|
Assets |
|
|
|
|
|
|
|
|
|
Current Assets: |
|
|
|
|
|
|
|
|
|
Cash |
|
$ |
9,161 |
|
|
$ |
7,843 |
|
|
Restricted cash |
|
|
2,227 |
|
|
|
1,150 |
|
|
Accounts receivable, net (allowance for expected credit losses of $244 at March 31, 2025 and December 31, 2024) |
|
|
2,364 |
|
|
|
2,693 |
|
|
Prepaid expenses and other current assets |
|
|
1,978 |
|
|
|
1,781 |
|
|
Equipment held for sale |
|
|
28 |
|
|
|
28 |
|
|
Total Current Assets |
|
|
15,758 |
|
|
|
13,495 |
|
|
Restricted cash, noncurrent |
|
|
3,060 |
|
|
|
1,460 |
|
|
Other assets |
|
|
1,124 |
|
|
|
2,724 |
|
|
Deposits and credits on equipment |
|
|
4,932 |
|
|
|
5,145 |
|
|
Property, plant and equipment, net |
|
|
49,585 |
|
|
|
47,283 |
|
|
Intangible assets, net |
|
|
15,292 |
|
|
|
17,620 |
|
|
Operating lease right-of-use assets |
|
|
298 |
|
|
|
313 |
|
|
Total Assets |
|
$ |
90,049 |
|
|
$ |
88,040 |
|
|
|
|
|
|
|
|
|
|
|
|
Liabilities and Stockholders’ Equity |
|
|
|
|
|
|
|
|
|
Current Liabilities: |
|
|
|
|
|
|
|
|
|
Accounts payable |
|
$ |
3,321 |
|
|
$ |
2,840 |
|
|
Accrued liabilities |
|
|
6,482 |
|
|
|
6,785 |
|
|
Accrued interest payable |
|
|
2,674 |
|
|
|
2,275 |
|
|
Contract liability |
|
|
19,348 |
|
|
|
20,015 |
|
|
Current portion of debt |
|
|
13,848 |
|
|
|
14,444 |
|
|
Income tax payable |
|
|
49 |
|
|
|
37 |
|
|
Customer deposits |
|
|
1,776 |
|
|
|
1,416 |
|
|
Operating lease liability |
|
|
62 |
|
|
|
61 |
|
|
Total Current Liabilities |
|
|
47,560 |
|
|
|
47,873 |
|
|
|
|
|
|
|
|
|
|
|
|
Other liabilities |
|
|
249 |
|
|
|
235 |
|
|
Long-term debt |
|
|
10,190 |
|
|
|
7,061 |
|
|
Operating lease liability |
|
|
236 |
|
|
|
252 |
|
|
Deferred tax liability, net |
|
|
4,821 |
|
|
|
5,257 |
|
|
Total Liabilities |
|
|
63,056 |
|
|
|
60,678 |
|
|
|
|
|
|
|
|
|
|
|
|
Commitments and Contingencies (Note 10) |
|
|
|
|
|
|
|
|
|
|
|
|
|
|
|
|
|
|
|
Stockholders’ Equity: |
|
|
|
|
|
|
|
|
|
9.0% Series A Cumulative Perpetual Preferred Stock, par value $0.001 per share, $25.00 liquidation preference; authorized 6,040,000; 4,953,545 shares issued and outstanding as of March 31, 2025 and December 31, 2024 |
|
|
5 |
|
|
|
5 |
|
|
Series B Preferred Stock, par value $0.0001 per share, authorized 187,500; 62,500 shares issued and outstanding as of March 31, 2025 and December 31, 2024 |
|
|
— |
|
|
|
— |
|
|
Common stock, par value $0.001 per share, authorized 75,000,000;12,548,786 shares issued and 12,508,045 shares outstanding as of March 31, 2025 and 10,647,761 shares issued and 10,607,020 shares outstanding as of December 31, 2024 |
|
|
13 |
|
|
|
11 |
|
|
Additional paid-in capital |
|
|
319,575 |
|
|
|
315,607 |
|
|
Accumulated deficit |
|
|
(321,860 |
) |
|
|
(314,304 |
) |
|
Common stock in treasury, at cost, 40,741 shares at March 31, 2025 and December 31, 2024 |
|
|
(13,798 |
) |
|
|
(13,798 |
) |
|
Total Soluna Holdings, Inc. Stockholders’ (Deficit) Equity |
|
|
(16,065 |
) |
|
|
(12,479 |
) |
|
Non-Controlling Interest |
|
|
43,058 |
|
|
|
39,841 |
|
|
Total Stockholders’ Equity |
|
|
26,993 |
|
|
|
27,362 |
|
|
Total Liabilities and Stockholders’ Equity |
|
$ |
90,049 |
|
|
$ |
88,040 |
|
The accompanying notes are an integral part of these unaudited condensed consolidated financial statements.
|
Soluna Holdings, Inc. and Subsidiaries Condensed Consolidated Statements of Operations (Unaudited) For the Three Months Ended March 31, 2025 and 2024 |
||||||||
|
|
|
|
|
|
|
|
||
|
|
|
For the three months ended |
|
|||||
|
|
|
March 31, |
|
|||||
|
(Dollars in thousands, except per share) |
|
2025 |
|
|
2024 |
|
||
|
|
|
|
|
|
|
|
||
|
Cryptocurrency mining revenue |
|
$ |
2,999 |
|
|
$ |
6,396 |
|
|
Data hosting revenue |
|
|
2,402 |
|
|
|
5,278 |
|
|
Demand response service revenue |
|
|
507 |
|
|
|
875 |
|
|
High-performance computing service revenue |
|
|
28 |
|
|
|
– |
|
|
Total revenue |
|
|
5,936 |
|
|
|
12,549 |
|
|
Operating costs: |
|
|
|
|
|
|
|
|
|
Cost of cryptocurrency mining revenue, exclusive of depreciation |
|
|
1,954 |
|
|
|
1,841 |
|
|
Cost of data hosting revenue, exclusive of depreciation |
|
|
1,327 |
|
|
|
2,251 |
|
|
Cost of high-performance computing services |
|
|
7 |
|
|
|
– |
|
|
Cost of cryptocurrency mining revenue- depreciation |
|
|
1,074 |
|
|
|
1,087 |
|
|
Cost of data hosting revenue- depreciation |
|
|
401 |
|
|
|
436 |
|
|
|
|
|
|
|
|
|
|
|
|
Total cost of revenue |
|
|
4,763 |
|
|
|
5,615 |
|
|
Operating expenses: |
|
|
|
|
|
|
|
|
|
General and administrative expenses, exclusive of depreciation and amortization |
|
|
5,946 |
|
|
|
3,994 |
|
|
Depreciation and amortization associated with general and administrative expenses |
|
|
2,404 |
|
|
|
2,403 |
|
|
Total general and administrative expenses |
|
|
8,350 |
|
|
|
6,397 |
|
|
Impairment on fixed assets |
|
|
– |
|
|
|
130 |
|
|
Operating (loss) income |
|
|
(7,177 |
) |
|
|
407 |
|
|
Interest expense |
|
|
(838 |
) |
|
|
(424 |
) |
|
Gain (loss) on debt extinguishment and revaluation, net |
|
|
551 |
|
|
|
(3,097 |
) |
|
Loss on sale of fixed assets |
|
|
– |
|
|
|
(1 |
) |
|
Other (expense) income, net |
|
|
(315 |
) |
|
|
23 |
|
|
Loss before income taxes |
|
|
(7,779 |
) |
|
|
(3,092 |
) |
|
Income tax benefit, net |
|
|
425 |
|
|
|
548 |
|
|
Net loss |
|
|
(7,354 |
) |
|
|
(2,544 |
) |
|
(Less) Net income attributable to non-controlling interest, net |
|
|
(202 |
) |
|
|
(2,710 |
) |
|
Net loss attributable to Soluna Holdings, Inc. |
|
$ |
(7,556 |
) |
|
$ |
(5,254 |
) |
|
|
|
|
|
|
|
|
|
|
|
Basic and Diluted loss per common share: |
|
|
|
|
|
|
|
|
|
Basic & Diluted loss per share |
|
$ |
(0.88 |
) |
|
$ |
(2.62 |
) |
|
|
|
|
|
|
|
|
|
|
|
Weighted average shares outstanding (Basic and Diluted) |
|
|
11,939,983 |
|
|
|
2,807,555 |
|
|
Soluna Holdings, Inc. and Subsidiaries Condensed Consolidated Statements of Cash Flows (Unaudited) For the Three Months Ended March 31, 2025 and 2024 |
||||||||
|
|
|
|
|
|
|
|
||
|
|
|
Three Months Ended March 31, |
|
|||||
|
(Dollars in thousands) |
|
2025 |
|
|
2024 |
|
||
|
Operating Activities |
|
|
|
|
|
|
|
|
|
Net loss |
|
$ |
(7,354 |
) |
|
$ |
(2,544 |
) |
|
|
|
|
|
|
|
|
|
|
|
Adjustments to reconcile net loss to net cash provided by (used in) by operating activities: |
|
|
|
|
|
|
|
|
|
Depreciation expense |
|
|
1,506 |
|
|
|
1,554 |
|
|
Amortization expense |
|
|
2,373 |
|
|
|
2,372 |
|
|
Stock-based compensation |
|
|
1,847 |
|
|
|
661 |
|
|
Deferred income taxes |
|
|
(437 |
) |
|
|
(548 |
) |
|
Impairment on fixed assets |
|
|
– |
|
|
|
130 |
|
|
Amortization of operating lease asset |
|
|
15 |
|
|
|
61 |
|
|
(Gain) loss on debt extinguishment and revaluation, net |
|
|
(551 |
) |
|
|
3,097 |
|
|
Amortization on deferred financing costs and discount on notes |
|
|
153 |
|
|
|
7 |
|
|
SEPA fair value revaluation |
|
|
118 |
|
|
|
– |
|
|
Loss on sale of fixed assets |
|
|
– |
|
|
|
1 |
|
|
Changes in operating assets and liabilities: |
|
|
|
|
|
|
|
|
|
Accounts receivable |
|
|
329 |
|
|
|
(1,480 |
) |
|
Prepaid expenses and other current assets |
|
|
(197 |
) |
|
|
(138 |
) |
|
Other long-term assets |
|
|
1,606 |
|
|
|
1 |
|
|
Accounts payable |
|
|
481 |
|
|
|
430 |
|
|
Contract liability |
|
|
(667 |
) |
|
|
– |
|
|
Operating lease liabilities |
|
|
(15 |
) |
|
|
(61 |
) |
|
Other liabilities and customer deposits |
|
|
374 |
|
|
|
(192 |
) |
|
Accrued liabilities and interest payable |
|
|
242 |
|
|
|
499 |
|
|
Net cash (used in) provided by operating activities |
|
|
(177 |
) |
|
|
3,850 |
|
|
Investing Activities |
|
|
|
|
|
|
|
|
|
Purchases of property, plant, and equipment |
|
|
(3,808 |
) |
|
|
(524 |
) |
|
Purchases of intangible assets |
|
|
(45 |
) |
|
|
(38 |
) |
|
Proceeds from disposal on property, plant, and equipment |
|
|
– |
|
|
|
78 |
|
|
Deposits of equipment, net |
|
|
213 |
|
|
|
(343 |
) |
|
Net cash used in investing activities |
|
|
(3,640 |
) |
|
|
(827 |
) |
|
Financing Activities |
|
|
|
|
|
|
|
|
|
Proceeds from common stock warrant exercises |
|
|
– |
|
|
|
300 |
|
|
Proceeds from SEPA |
|
|
2,005 |
|
|
|
– |
|
|
Proceeds from notes |
|
|
5,000 |
|
|
|
– |
|
|
Payments on notes and deferred financing costs |
|
|
(1,978 |
) |
|
|
(616 |
) |
|
Contributions from non-controlling interest |
|
|
4,310 |
|
|
|
– |
|
|
Distributions to non-controlling interest |
|
|
(1,525 |
) |
|
|
(1,680 |
) |
|
Net cash provided by (used in) financing activities |
|
|
7,812 |
|
|
|
(1,996 |
) |
|
|
|
|
|
|
|
|
|
|
|
Increase in cash & restricted cash |
|
|
3,995 |
|
|
|
1,027 |
|
|
Cash & restricted cash – beginning of period |
|
|
10,453 |
|
|
|
10,367 |
|
|
Cash & restricted cash – end of period |
|
$ |
14,448 |
|
|
$ |
11,394 |
|
|
|
|
|
|
|
|
|
|
|
|
Supplemental Disclosure of Cash Flow Information |
|
|
|
|
|
|
|
|
|
Interest paid on NYDIG loans |
|
|
– |
|
|
|
115 |
|
|
Interest paid on Navitas loan |
|
|
3 |
|
|
|
57 |
|
|
Interest paid on June and July SPA notes |
|
|
282 |
|
|
|
– |
|
|
Warrant consideration in relation to convertible notes and revaluation |
|
|
– |
|
|
|
4,333 |
|
|
Notes converted to common stock |
|
|
– |
|
|
|
1,023 |
|
|
Noncash deferred financing cost accrual |
|
|
97 |
|
|
|
– |
|
|
Noncash membership distribution accrual |
|
|
949 |
|
|
|
1,069 |
|
|
For the three months ended March 31, 2025 |
||||||||||||||||||
|
|
|
Cryptocurrency Mining |
|
|
Data Center Hosting |
|
|
High-Performance Computing Services |
|
|
Total |
|
||||||
|
Segment Revenue: Revenue from external customers |
|
$ |
2,999 |
|
|
$ |
2,402 |
|
|
$ |
28 |
|
|
$ |
5,429 |
|
||
|
Reconciliation of revenue |
|
|
|
|
|
|
|
|
|
|
|
|
|
|
|
|
||
|
Demand response revenue (a) |
|
|
|
|
|
|
|
|
|
|
|
|
|
|
507 |
|
|
|
|
Total consolidated revenue |
|
|
|
|
|
|
|
|
|
|
|
|
|
|
5,936 |
|
|
|
|
Less: Segment cost of revenue |
|
|
|
|
|
|
|
|
|
|
|
|
|
|
|
|
||
|
Utility costs |
|
|
1,412 |
|
|
|
389 |
|
|
|
|
– |
|
|
|
1,801 |
|
|
|
Wages, benefits, and employee related costs |
|
|
219 |
|
|
|
470 |
|
|
|
|
7 |
|
|
|
696 |
|
|
|
Facilities and Equipment costs |
|
|
207 |
|
|
|
365 |
|
|
|
|
– |
|
|
|
572 |
|
|
|
Cost of revenue- depreciation |
|
|
1,074 |
|
|
|
401 |
|
|
|
|
– |
|
|
|
1,475 |
|
|
|
Other cost of revenue* |
|
|
140 |
|
|
|
144 |
|
|
|
|
– |
|
|
|
284 |
|
|
|
Total segment cost of revenue |
|
|
3,052 |
|
|
|
1,769 |
|
|
|
|
7 |
|
|
|
4,828 |
|
|
|
General and administrative expenses |
|
|
14 |
|
|
|
90 |
|
|
|
|
159 |
|
|
|
263 |
|
|
|
Segment operating income (loss) |
|
$ |
(67 |
) |
|
$ |
543 |
|
|
|
$ |
(138 |
) |
|
$ |
338 |
|
|
|
For the three months ended March 31, 2024 |
||||||||||||||||||||
|
|
|
Cryptocurrency Mining |
|
|
Data Center Hosting |
|
|
High-Performance Computing Services |
|
|
Total |
|
||||||||
|
Segment Revenue: Revenue from external customers |
|
$ |
6,396 |
|
|
$ |
5,278 |
|
|
$ |
– |
|
|
$ |
11,674 |
|
||||
|
Reconciliation of revenue |
|
|
|
|
|
|
|
|
|
|
|
|
|
|
|
|
||||
|
Demand response revenue (a) |
|
|
|
|
|
|
|
|
|
|
– |
|
|
|
|
875 |
|
|
||
|
|
|
|
|
|
|
|
|
|
|
|
|
|
|
|
12,549 |
|
|
|||
|
Less: Segment cost of revenue |
|
|
|
|
|
|
|
|
|
|
|
|
|
|
|
|
||||
|
Utility costs |
|
|
1,377 |
|
|
|
|
1,357 |
|
|
|
|
– |
|
|
|
|
2,734 |
|
|
|
Wages, benefits, and employee related costs |
|
|
191 |
|
|
|
|
460 |
|
|
|
|
– |
|
|
|
|
651 |
|
|
|
Facilities and Equipment costs |
|
|
175 |
|
|
|
|
299 |
|
|
|
|
– |
|
|
|
|
474 |
|
|
|
Cost of revenue- depreciation |
|
|
1,087 |
|
|
|
|
436 |
|
|
|
|
– |
|
|
|
|
1,523 |
|
|
|
Other cost of revenue* |
|
|
178 |
|
|
|
|
217 |
|
|
|
|
– |
|
|
|
|
395 |
|
|
|
Total segment cost of revenue |
|
|
3,008 |
|
|
|
|
2,769 |
|
|
|
|
– |
|
|
|
|
5,777 |
|
|
|
General and administrative expenses |
|
|
29 |
|
|
|
|
35 |
|
|
|
|
– |
|
|
|
|
64 |
|
|
|
Impairment on fixed assets |
|
|
130 |
|
|
|
|
– |
|
|
|
|
– |
|
|
|
|
130 |
|
|
|
Segment operating income |
|
$ |
3,229 |
|
|
|
$ |
2,474 |
|
|
|
$ |
– |
|
|
|
$ |
5,703 |
|
|
|
(a) |
|
Demand response service revenue is included as a reconciling item of total revenue and not included as part of segment gross profit or loss. |
|
* |
Other cost of revenue includes insurance, outside service costs and margins, and general costs. |
The following table presents the reconciliation of segment operating income (loss) to net income (loss) before taxes:
|
|
|
|
|
|
|
|
||
|
|
|
For the three months ended March 31, |
|
|||||
|
|
|
2025 |
|
|
2024 |
|
||
|
Segment operating income |
|
$ |
338 |
|
|
$ |
5,703 |
|
|
|
|
|
|
|
|
|
|
|
|
Reconciling Items: |
|
|
|
|
|
|
|
|
|
Elimination of intercompany costs |
|
|
65 |
|
|
|
162 |
|
|
Other revenue (a) |
|
|
507 |
|
|
|
875 |
|
|
General and administrative, exclusive of depreciation and amortization (b) |
|
|
(5,683 |
) |
|
|
(3,930 |
) |
|
General and administrative, depreciation and amortization |
|
|
(2,404 |
) |
|
|
(2,403 |
) |
|
Interest expense |
|
|
(838 |
) |
|
|
(424 |
) |
|
Gain (loss) on debt extinguishment and revaluation, net |
|
|
551 |
|
|
|
(3,097 |
) |
|
Loss on sale of fixed assets |
|
|
– |
|
|
|
(1 |
) |
|
Other (expense) income, net |
|
|
(315 |
) |
|
|
23 |
|
|
Net loss before taxes |
|
$ |
(7,779 |
) |
|
$ |
(3,092 |
) |
The following table summarizes the balances for the project sites for cryptocurrency mining revenue, data hosting revenue, high-performance computing service revenue, demand response revenue, cost of cryptocurrency mining revenue, exclusive of depreciation, cost of data hosting revenue, exclusive of depreciation, cost of high-performance computing services, and cost of depreciation during the three months ended March 31, 2025:
|
|
|
Soluna Digital |
|
|
Soluna Cloud |
|
|
|
|
|||||||||||||||||||||||||
|
(Dollars in thousands) |
|
Project Dorothy 1B |
|
|
Project Dorothy 1A |
|
|
Project Sophie |
|
|
Other |
|
|
Soluna Digital Subtotal |
|
|
Project Ada |
|
|
Total |
|
|||||||||||||
|
|
|
|
|
|
|
|
|
|
|
|
|
|
|
|
|
|
|
|
|
|
|
|||||||||||||
|
Cryptocurrency mining revenue |
|
$ |
2,999 |
|
|
$ |
– |
|
|
|
$ |
– |
|
|
|
$ |
– |
|
|
|
$ |
2,999 |
|
|
$ |
– |
|
|
|
$ |
2,999 |
|
||
|
Data hosting revenue |
|
|
– |
|
|
|
1,371 |
|
|
|
1,031 |
|
|
|
– |
|
|
|
|
2,402 |
|
|
|
|
– |
|
|
|
|
2,402 |
|
|
||
|
Demand response services |
|
|
– |
|
|
|
– |
|
|
|
|
– |
|
|
|
|
507 |
|
|
|
507 |
|
|
|
|
– |
|
|
|
|
507 |
|
|
|
|
High-performance computing services |
|
|
– |
|
|
|
– |
|
|
|
|
– |
|
|
|
|
– |
|
|
|
|
– |
|
|
|
|
28 |
|
|
|
28 |
|
|
|
|
Total revenue |
|
|
2,999 |
|
|
|
1,371 |
|
|
|
|
1,031 |
|
|
|
|
507 |
|
|
|
|
5,908 |
|
|
|
|
28 |
|
|
|
|
5,936 |
|
|
|
|
|
|
|
|
|
|
|
|
|
|
|
|
|
|
|
|
|
|
|
|
|
|
|
|
|
|
|
|
||||||
|
Cost of cryptocurrency mining, exclusive of depreciation |
|
$ |
1,954 |
|
|
|
– |
|
|
|
|
– |
|
|
|
|
– |
|
|
|
|
1,954 |
|
|
|
|
– |
|
|
|
|
1,954 |
|
|
|
Cost of data hosting revenue, exclusive of depreciation |
|
|
– |
|
|
|
885 |
|
|
|
|
372 |
|
|
|
|
70 |
|
|
|
|
1,327 |
|
|
|
|
– |
|
|
|
|
1,327 |
|
|
|
Cost of high-performance computing service revenue |
|
|
– |
|
|
|
– |
|
|
|
|
– |
|
|
|
|
– |
|
|
|
|
– |
|
|
|
|
7 |
|
|
|
|
7 |
|
|
|
Cost of cryptocurrency mining revenue- depreciation |
|
|
1,074 |
|
|
|
– |
|
|
|
|
– |
|
|
|
|
– |
|
|
|
|
1,074 |
|
|
|
|
– |
|
|
|
|
1,074 |
|
|
|
Cost of data hosting revenue- depreciation |
|
|
– |
|
|
|
295 |
|
|
|
|
106 |
|
|
|
|
– |
|
|
|
|
401 |
|
|
|
|
– |
|
|
|
|
401 |
|
|
|
Total cost of revenue |
|
|
3,028 |
|
|
|
1,180 |
|
|
|
|
478 |
|
|
|
|
70 |
|
|
|
|
4,756 |
|
|
|
|
7 |
|
|
|
|
4,763 |
|
|
|
Gross (loss) profit |
|
$ |
(29 |
) |
|
$ |
191 |
|
|
|
$ |
553 |
|
|
|
$ |
437 |
|
|
|
$ |
1,152 |
|
|
|
$ |
21 |
|
|
|
$ |
1,173 |
|
|
Contacts
John Tunison
Chief Financial Officer
Soluna Holdings, Inc.
[email protected]
